Dashboards
Keep Your Eyes On Your Whole Business Analysis
Get The Indicators Of Your Company's
Well-Being At A Glance
Gather all your Zildia reports in one app
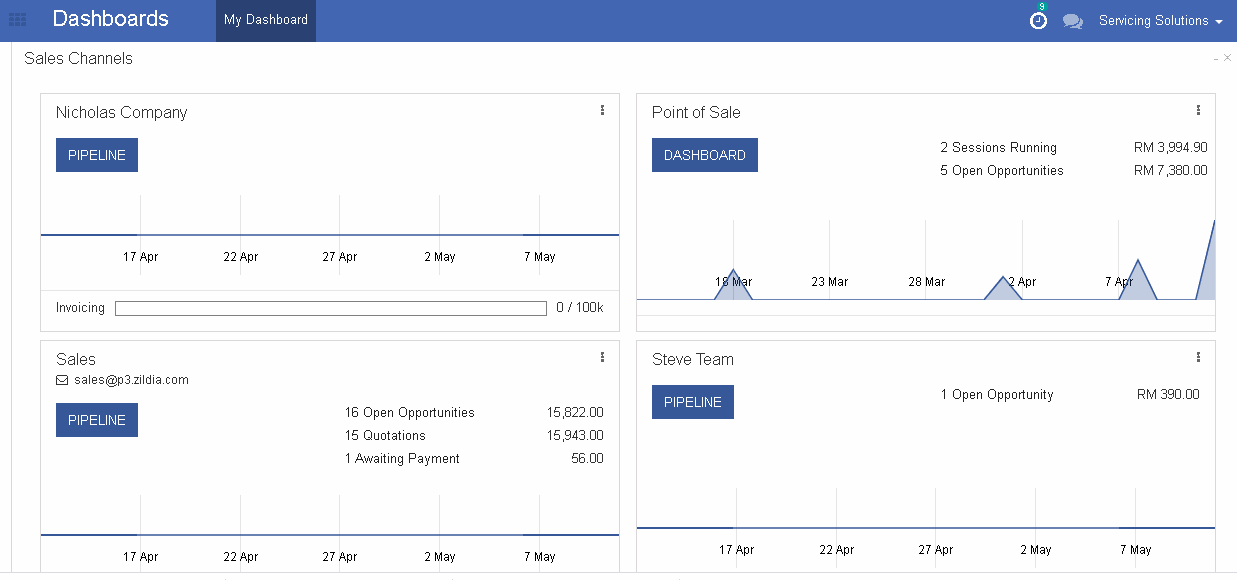
After creating reports in each Zildia app, you can choose to make them as Favourite and adding those on your "Dasboards" .Zildia dashboard is the reporting module that gathers all your favourite graphs and tabs in one place. Your company has no secret for you anymore, all your important figures are in front of you.
Statistics About Your Data
Generate graphs and charts in just 1 click
In each Zildia app, you can create detailed reports and graphs in any format you like without the need of an external program. Get statistics on any numbers in your company, from fuel costs in projects all the way to revenue in sales channels, and with inventory, and everything in between.
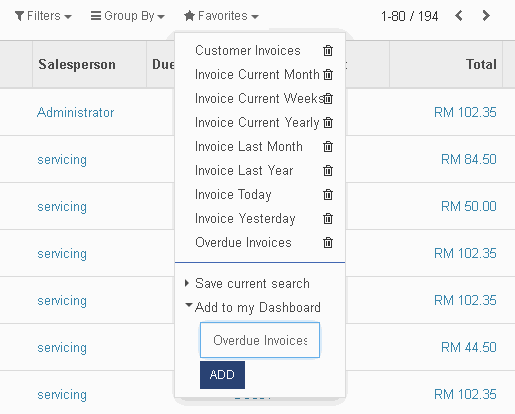
The Information You Need The Way You Need It
Filter all results to fit your field of research
In each Zildia app, you'll need to create a report. In the report you can filter and group each analysis using built-in filters, and create custom filters to gether only the information you are looking for. Save the filters you created in your favourite to access them anytime in just a click either from the concerned app , or in comparison with your other reports in the Zildia Dashboard app.
Track The Process
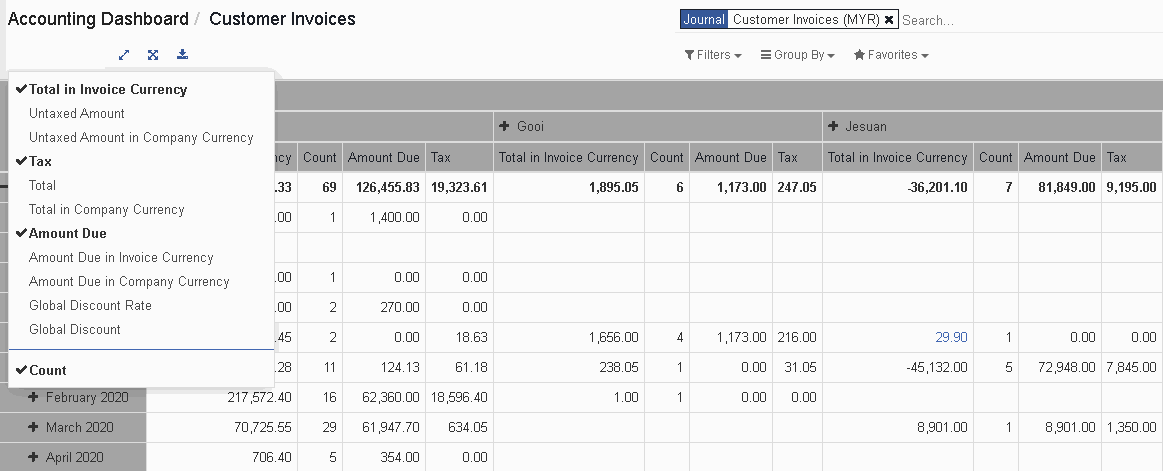
Keep track of all your important data
Track the process of each activity, from project to reports and invoices, and get statistical information on all topics, in a simple and clear tabular chart. Get a clear overview of your whole activity and be ready for new challenges.